Who Trades FX? From Central Banks to Your Vacation Money
The foreign exchange market exists so that money can cross borders. Yet companies paying for real goods and services now account for less than 5% of it. Here is who actually trades currency, why they are there, and why the smallest group in the room is often the one that moves the price.
The Currency Stack 26 September 2026 20 min read
- The Bank for International Settlements sorts the whole $9.6-trillion-a-day FX market into three counterparty groups: reporting dealers (46% of turnover), other financial institutions (50%), and non-financial customers (5%).
- “Other financial institutions” is the largest and least understood group — smaller banks at $2.4 trillion a day, real-money institutional investors at $1.3 trillion, hedge funds and proprietary trading firms at $758 billion, and the official sector at $138 billion.
- Corporations importing, exporting, and repatriating profits — the original reason the market exists — are now under 5% of turnover, and their share has fallen at every survey since 2019.
- Retail traders reach the market indirectly. Turnover the BIS identifies as retail-driven was about $242 billion a day in April 2025, roughly 2.5% of the total.
- Volume and influence are not the same thing. FX microstructure research consistently finds that the groups trading the least — central banks above all — carry the most information in their orders, while corporate flow moves dealer prices least.
Who are the main participants in the FX market?
Dealer banks that quote prices, other financial institutions (smaller banks, asset managers, hedge funds, proprietary trading firms, and the official sector), non-financial corporations, and retail traders who access the market through brokers.
Who trades the most foreign exchange?
Financial institutions. Dealers trading with each other account for 46% of global turnover and dealers trading with other financial firms account for 50% — leaving about 5% for everyone else combined.
Do central banks trade currency?
Yes, though in small volumes relative to the market. They manage foreign exchange reserves, execute payments for governments, and occasionally intervene to influence their own currency. Official-sector turnover was about $138 billion a day in April 2025.
How do retail traders access the FX market?
Almost never directly. A retail order passes through a broker, which typically reaches wholesale liquidity through a prime broker or prime-of-prime relationship — a chain of credit and intermediation that stands between the individual and the interbank price.
Why do corporations trade so little of the total?
Because the financial layer built on top of trade has grown far faster than trade itself. Hedging, portfolio flows, and dealer risk transfer generate many currency transactions for each underlying shipment of goods.
Does it matter who is on the other side of a trade?
To a dealer, enormously. Different participants carry different information and different risk, and pricing reflects that — which is why the same trade can be quoted differently to two clients.
A quick-read summary of the full article below.
The foreign exchange market has a simple origin story. Someone in one country wants to buy something from someone in another, the two of them use different money, and a market forms to convert one into the other. Every textbook opens this way, and it is true.
It is also, as a description of the modern market, almost entirely wrong. In April 2025 the Bank for International Settlements measured $9.6 trillion of foreign exchange turnover a day. Non-financial customers (the importers, exporters, and corporate treasurers of the origin story) accounted for less than 5% of it. The overwhelming majority of the largest market on earth is financial institutions trading with other financial institutions.
So who are they? And if the people with an actual shipment of goods to pay for are a rounding error, what is everyone else doing? This article maps the participants, from the central banks that can create currency to the traveler buying euros at an airport kiosk — and ends on the part that surprises most people, which is that the groups trading the least are frequently the ones that move the price. We introduced this market in What Is the FX Market and Why Does It Matter?; this article opens up the cast.
Three Groups, and Nearly All of Them Are Financial
Every three years the BIS asks central banks to survey the dealers in their jurisdictions, and the resulting Triennial Central Bank Survey is the closest thing the FX market has to a census. It sorts every trade by the type of counterparty on the other side, into three categories.
Reporting dealers are the large banks that make prices — the institutions that quote a buy and a sell price to everyone else and stand ready to deal on both. Trading between them, known as inter-dealer trading, averaged $4.4 trillion a day in April 2025, or 46% of global turnover.
Other financial institutions is everything financial that is not a reporting dealer: smaller and regional banks, pension funds, insurers, mutual funds, hedge funds, high-speed proprietary trading firms, sovereign wealth funds, and central banks. Dealers’ trading with this group came to $4.8 trillion a day, or 50% of turnover — the largest single slice, and the fastest-growing one. It was 35% bigger than in 2022.
Non-financial customers covers the rest: corporations, non-financial government entities, and individuals dealing directly with a bank. That group accounted for about 5% of turnover in 2025, down from 6% in 2022 and 7% in 2019.
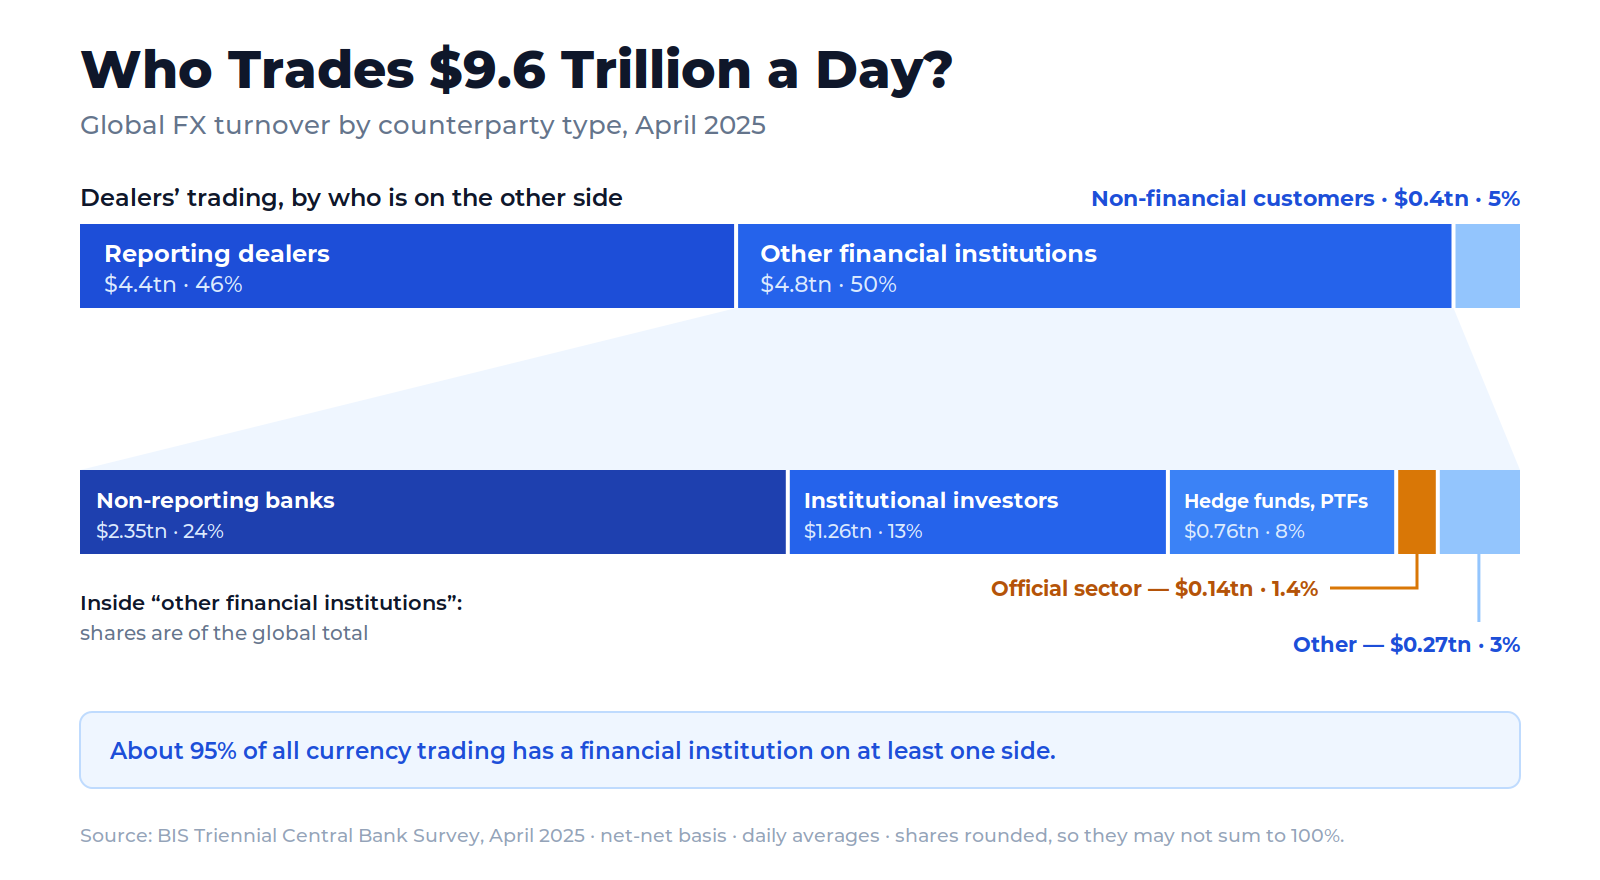
Two things about that split are worth sitting with. The first is how lopsided it is: roughly 95% of the world’s currency trading involves a financial institution on at least one side, and a large share of it involves financial institutions on both. The second is the direction of travel. The corporate share has fallen at every recent survey, not because companies trade less in absolute terms, but because the financial activity layered on top of trade has grown faster than trade itself.
Why Anyone Trades Currency at All
Before the who, the why. Strip away the labels and there are only a handful of reasons to exchange one currency for another, and almost every participant is doing some combination of them.
- Payment and trade. A company imports goods priced in dollars and holds euros, or exports and receives a currency it does not want to keep. Someone must convert.
- Investment flows. Buying a foreign asset requires foreign currency first. A pension fund adding Japanese equities needs yen before it needs shares — and when it wants to own the shares without the currency risk, it hedges, which generates a second set of trades.
- Hedging. A known future foreign-currency obligation can be locked in today rather than left to chance. This is the bulk of what corporate treasurers and real-money investors do in the market.
- Speculation. Taking a position because you expect a rate to move. Hedge funds and proprietary trading firms do this deliberately; so, in a narrower and more continuous way, does every dealer holding inventory.
- Policy and reserve management. Central banks and other official institutions hold foreign currency reserves, rebalance them, execute payments for their governments, and sometimes intervene to influence their own exchange rate.
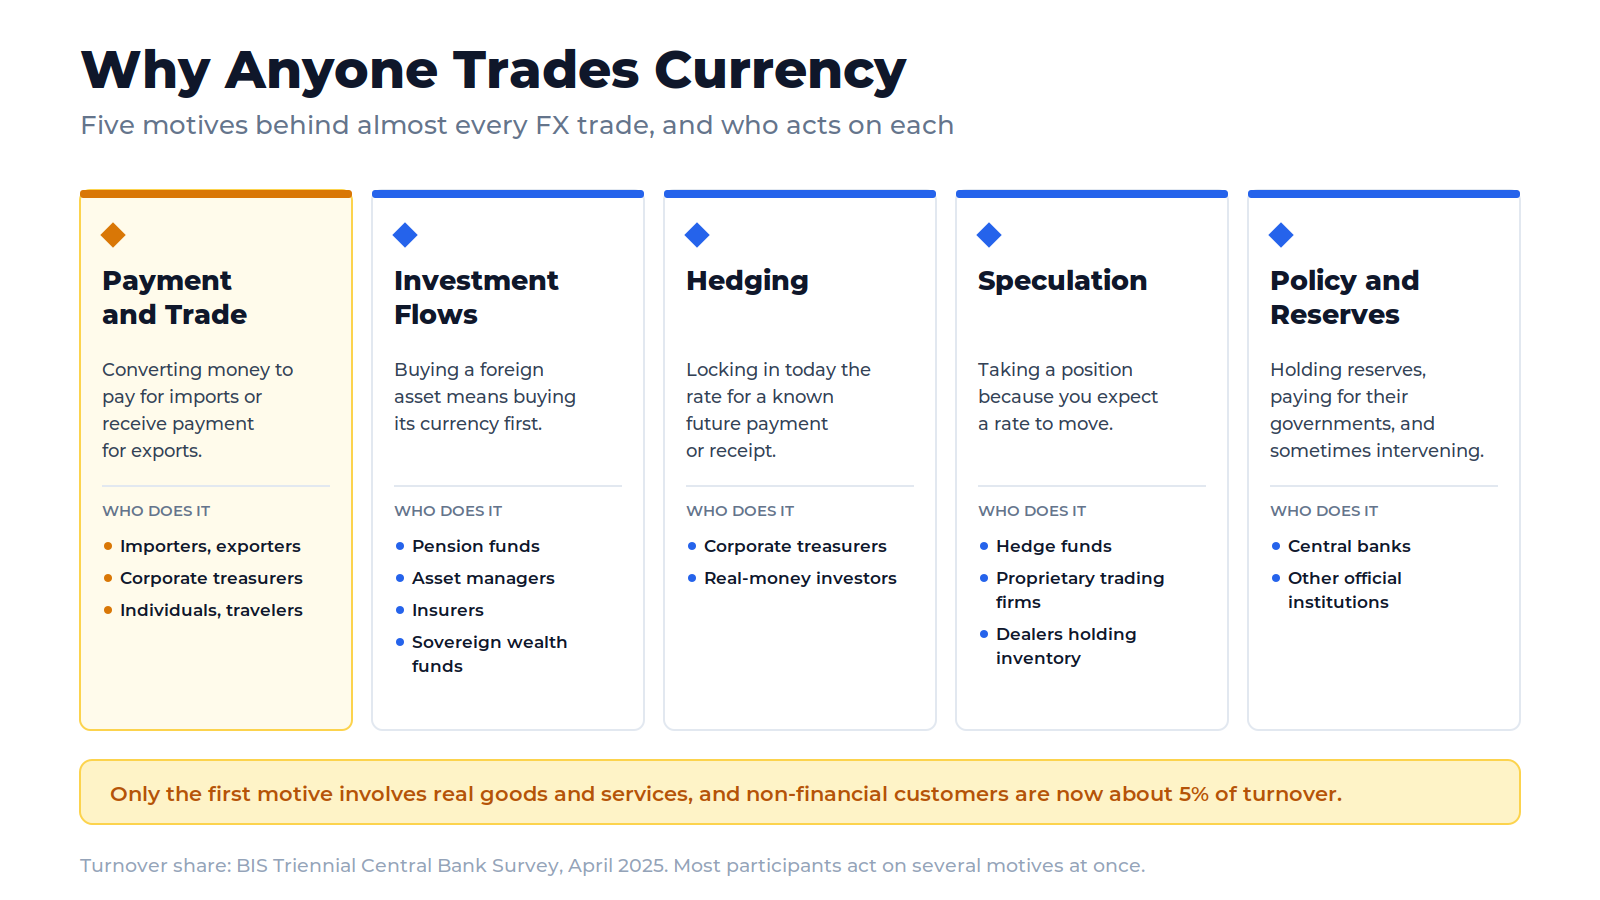
Notice that only the first of these involves an underlying transaction in real goods. The other four are financial motives, and they are what the modern market mostly consists of. This is not a flaw in the market; it is what a deep market looks like. Every hedge a corporate treasurer places has to be absorbed by someone who takes the other side, and that someone then lays the risk off again, and the chain continues.
The Dealers at the Center
At the heart of the market sit the dealer banks. Their business is market making: quoting a two-way price (a bid at which they will buy and an offer at which they will sell) and earning the difference between the two, known as the spread. A market maker is not betting on where the currency goes. It is being paid to stand between buyers and sellers and hold the resulting risk for the minutes or seconds until it can be offset.
That last part explains why dealers trade so heavily with each other. When a client sells a dealer €200 million, the dealer now owns euros it did not want. It can wait for an offsetting client order, hold the position deliberately, or go into the inter-dealer market and pass some of the risk on. The bank that takes the other side faces the same decision, and so on. A single customer trade can therefore generate a chain of further trades as risk moves through the system — which is a large part of why $9.6 trillion changes hands daily in a world that does not import and export anything close to that.
The BIS has started measuring the mechanical end of this. It separates out non-market-facing trades (internal “back-to-back” deals that shift risk between a bank’s own desks and offices, plus portfolio compression trades) and found they came to $1.2 trillion a day, about 13% of global turnover in 2025. That is worth knowing before quoting the headline number: a meaningful slice of the market is the market’s own internal bookkeeping.
How the dealer core actually connects (the credit relationships, the electronic venues, the order of the layers a trade passes through) is a subject of its own, and we take it apart in the members’ guide to FX market structure.
Inside the Biggest Group You Have Never Heard Of
“Other financial institutions” sounds like a residual category. It is in fact the largest counterparty group in the market, and the BIS breaks it into four parts plus a remainder.
Non-reporting banks (mainly smaller and regional commercial banks, publicly owned banks, and securities firms that are not themselves survey dealers) are the biggest single component at $2.4 trillion a day, or 24% of all turnover, up from 21% in 2022. Their presence is easy to overlook and easy to explain: a regional bank has customers who need foreign currency but no global dealing operation of its own, so it sources price from the large dealers and passes it on. Much of the market’s second tier is simply banking for banks.
Institutional investors (mutual funds, pension funds, insurers, endowments, the group the market calls real money) traded $1.3 trillion a day, 13% of turnover, up from 11% in 2022. They are in the market because they own foreign assets. Their currency trading is mostly a consequence of an investment decision made elsewhere, which is why it tends to be large, unhurried, and concentrated around portfolio rebalancing and hedging dates.
Hedge funds and proprietary trading firms traded $758 billion a day, 8% of turnover, up from 7%. This is the group most people picture when they imagine currency trading, and it is smaller than they expect. It also contains two quite different animals: discretionary and systematic funds taking positions over days or months, and high-frequency proprietary firms whose holding periods are measured in seconds and whose daily positions often end flat.
Execution inside every one of these groups is already heavily automated, and where that goes next is an open question. If autonomous AI systems start transacting FX directly (carrying out a treasurer’s hedging policy or a fund’s mandate without a person confirming each trade), they will not be a new counterparty group in the BIS sense. They will be a new method used by the participants who already exist. Worth watching, not yet worth its own category.
The official sector (central banks, sovereign wealth funds, development banks, and international institutions like the IMF and BIS) accounted for $138 billion a day, about 1.4% of turnover. It is the smallest named group in the survey. Hold that thought.
The remainder, roughly 3% of turnover, includes retail aggregators — the wholesale firms that stand between retail brokers and the dealer market.
Central Banks: The Smallest Group in the Room
A central bank is unlike every other participant in one decisive respect: it is the monopoly supplier of its own currency, and it sets the interest rate that is the single biggest long-run influence on that currency’s value. It is not a large trader. It does not need to be.
Central banks are in the market for three overlapping reasons. They manage foreign exchange reserves, which must be held, rebalanced, and occasionally converted. They act as bankers to their governments, executing payments and receipts in foreign currency. And some of them intervene — buying or selling their own currency deliberately to influence its level or to calm disorderly trading.
Intervention itself is rarely as tidy as “the central bank bought its currency.” The common mechanism, especially for a large, telegraphed move, is that the central bank telephones the handful of banks with primary access to its currency and asks them to buy or sell on its behalf — a voice call, not an anonymous electronic order, made to several dealing desks at once. That is not an oversight. A phone call to multiple banks is far more likely to leak than a screen order, and central banks are generally glad when it does: the point is to move the price by more than the money spent would justify on its own, which only works if the market believes, or strongly suspects, that the central bank is still in the room.
Whether intervention works is one of the longest-running arguments in FX. The honest answer is that the evidence is mixed and depends heavily on what you mean by “works.” Early studies found intervention largely ineffective, and surveys of dealers have repeatedly found that most of them believe intervention mainly raises volatility. More recent microstructure research (studies that look at intraday transaction data rather than monthly averages) finds effects that are statistically real but short-lived, concentrated in the minutes and hours around the trade, and larger in smaller currency markets than in the deepest ones. The research also suggests the market often begins moving in the direction of an intervention before it is publicly reported, which tells you something about how quickly information travels between dealers.
A recent case shows the mechanism and its limits at once. On July 31, 2026, Japan and the United States ran their first joint yen-buying intervention since 1998, after the yen had fallen to roughly ¥164 per dollar, a 40-year low. Japan’s Ministry of Finance, acting through the Bank of Japan, later reported ¥15.4 trillion (about $96 billion) of intervention between July 30 and August 26, the largest monthly total on record, most of it thought to have been spent in the last days of July; the U.S. Treasury, through the New York Fed, added a smaller amount that Treasury Secretary Scott Bessent’s own notes put at $5 billion to $10 billion. What drew the most comment from currency economists was not the size but the funding: the U.S. reportedly sold euros from its reserves to buy yen rather than selling dollars outright, an unusual choice some called less effective, currency for currency, than a straight dollar sale. The yen jumped from around ¥164 to roughly ¥155 — then drifted back toward ¥158–159 within a few weeks, a sharp move followed by a partial reversal that tracks closely with what the microstructure research above would predict (figures as of September 2026).
What is not in dispute is that when a central bank deals, dealers pay attention. That is the beginning of an idea we will come back to at the end: in this market, the size of a participant’s trading and the weight of its trading are two different things.
Corporations: The Reason the Market Exists, and 5% of It
Corporate flow is the part of the market a newcomer finds most intuitive and a dealer finds least exciting.
Its composition is straightforward. Companies convert currency to pay for imports and to receive payment for exports. They repatriate profits from foreign subsidiaries. They fund and unwind foreign direct investments. And above all they hedge — locking in the rate on a known future receipt or payment so that a year’s margin is not decided by an exchange rate. Where a company sits on that last point is a treasury policy decision, not a market view.
Two caveats keep the 5% figure honest. The first is that some corporate activity does not show up as corporate: large groups often route currency business through their own financing arms, which the survey classifies as financial institutions. The second is that corporate flow is understated in importance by its size. It is the layer of demand everything else is ultimately built on, even if the trading it directly generates is modest.
And there is a genuine finding buried here that runs against instinct. Research on dealer transaction data has consistently found that corporate orders carry the least information for short-term pricing of any customer group. The reason is not that corporates are unsophisticated — it is that their trading is driven by commercial calendars rather than by a view on the currency. An invoice falls due; the trade happens; the timing says nothing about where the rate is going next. A dealer taking the other side of that order is not, in the main, being told anything.
Your Vacation Money and the Chain That Carries It
At the far end of the market is you, and the route from here to there is longer than most people realize.
Start with the simplest case: buying foreign currency for a trip. Whether it is cash at a bureau de change, a card payment abroad, or a transfer, the rate you receive is a wholesale market rate plus a markup — a margin added by whoever is serving you. Nothing about that is sinister; it is how a retail business covers its costs. But the markup is usually far larger, in percentage terms, than anything a professional counterparty pays, and it is the single biggest determinant of what your euros actually cost. We take that apart in detail in the members’ guide to FX spreads.
Now the case of the retail trader. Individuals speculating in currency reach the market through a broker, and the broker itself is usually not large enough to face the dealer banks directly. It reaches wholesale liquidity through a prime broker (a large bank that lends its name and credit so that a smaller firm can deal with the major dealers) or through a prime-of-prime, which performs the same service one rung further down. Prime-brokered turnover was $2.2 trillion a day in April 2025, roughly 22% of the market, which gives a sense of how much activity depends on borrowed credit rather than direct relationships.
How big is the retail end? The BIS separately identifies retail-driven turnover: dealers’ trading with the wholesale firms that serve retail platforms and margin brokers, plus their direct dealing with individuals. In April 2025 it came to about $242 billion a day — roughly 2.5% of global turnover. That is a real number, larger than the entire official sector, and simultaneously a reminder that the retail segment is a small tributary of a very large river.
One point of framing, since this is where money decisions live: nothing here is a recommendation to trade currency, and understanding the market’s structure is not the same as having an edge in it. The Currency Stack explains how markets work; what anyone does with that is their own call, and professional advice is worth having before risking money.
Size Is Not the Same as Influence
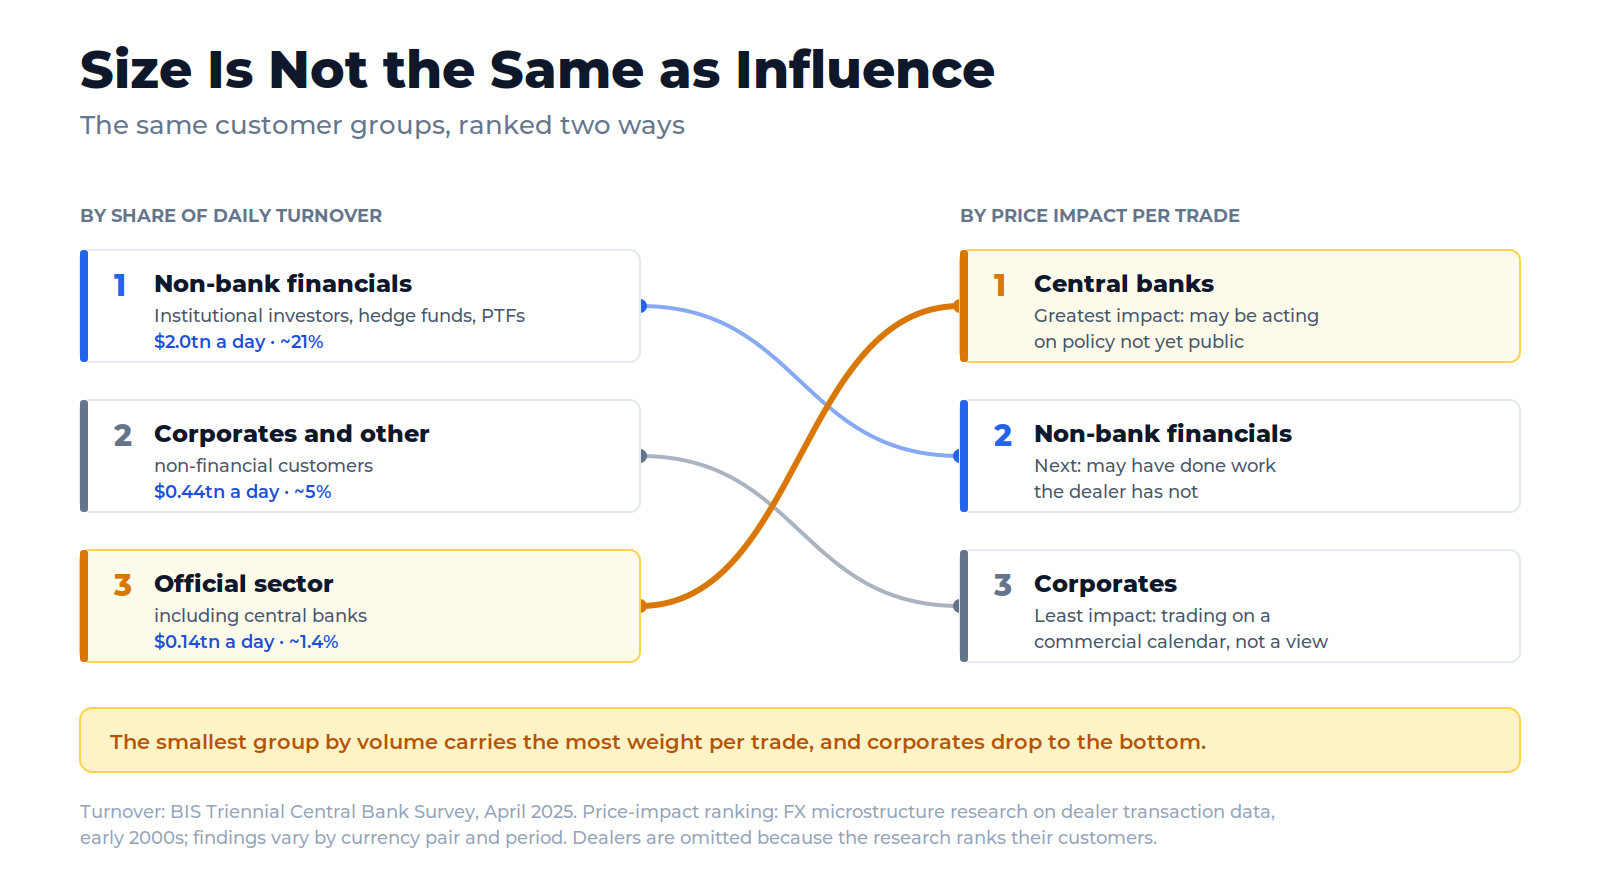
Line the participants up by turnover and you get one ranking: dealers, then other financials, then everyone else, with central banks and retail near the bottom. Line them up by how much a given trade moves the price, and the ranking substantially inverts.
This is one of the more robust findings in FX microstructure research. Studying the transaction records of a dealing bank (every trade, tagged by who was on the other side), researchers have found a consistent information hierarchy. Central bank orders have carried the greatest price impact. Non-bank financial institutions such as hedge funds and mutual funds come next. Non-financial corporations come last, with the least effect on dealer pricing. The same work found that the impact within each group is concentrated in the largest counterparties, and that it tends to be spread over time rather than appearing instantly — dealers do not simply re-quote the moment an informative order arrives; they trade on what they have learned.
Two caveats matter. These studies rest on the records of individual banks in specific currency pairs over specific periods, mostly in the early 2000s, and the findings are not uniform — the same research that found central banks most informative in one currency pair found no measurable impact from a different set of central banks in another. And the hierarchy describes short-term price discovery, not who is right about the currency in the long run.
Still, the logic holds up, and it explains a great deal about how the market behaves. A trade tells a dealer something when it might be motivated by information the dealer does not have. A central bank may be acting on a policy decision not yet public. A macro fund may have done work the dealer has not. A corporate paying an invoice is acting on a calendar. Price the three the same and you will systematically lose money to one of them.
That is why, for a professional, “who are you?” is not a social question. Dealers classify flow, skew prices toward the risk they want, and vary what they show to different counterparties — a set of practices we examine in the members’ guide to toxic flow. The same order can be welcome from one client and expensive from another, and the difference is not favoritism. It is the dealer’s read of what the order might know.
The Bottom Line
The FX market is usually described by its size, and the size is genuinely remarkable. But the more revealing description is the census: a market built for trade in goods, now 95% financial; a market people associate with hedge funds, where hedge funds are 8%; a market where the official sector is 1.4% of turnover and, plausibly, the most closely watched participant in it.
Knowing who is in the room changes how the numbers read. When turnover surges, the useful question is which group is transacting — institutional investors hedging dollar exposure behave nothing like proprietary firms cycling positions in seconds, and the two leave very different marks on the price. It also changes how you read your own position in the chain. Whether you are hedging a business payment, moving a portfolio, or buying euros for a holiday, you are dealing at some remove from a wholesale price set by a small number of institutions trading enormous amounts with each other — and the distance between you and that price, more than anything else, is what your currency costs.
The next question is the obvious one: given all these participants pushing in different directions, what actually determines the rate they settle on? That is the subject of What Moves Currency Prices.
The Currency Stack provides educational and research content only. Nothing here is financial, investment, or trading advice, or a recommendation to buy or sell any asset. Markets carry risk; do your own research and consider professional advice before acting.
Further reading: This article opens up the cast of the market introduced in What Is the FX Market and Why Does It Matter?, and what these participants actually trade is mapped in FX Instruments: The Complete Map. For what moves them on a given day, read Reading Economic Data: NFP, CPI, and Rate Decisions; for what sets the rate they settle on, What Moves Currency Prices? Rates, Risk, and Macro. Members can go deeper on the plumbing in The FX Market: Interbank, Prime Brokers, ECNs and “Last Look”, the retail markup in Understanding FX Spreads, and this article’s closing argument in Toxic Flow: Why Your Broker Cares Who You Are. Key terms are defined in our glossary. Sources: Bank for International Settlements, Triennial Central Bank Survey (April 2025); Japan Ministry of Finance intervention data and public reporting on the July 2026 U.S.–Japan yen intervention; academic research on private information and price impact in FX dealer transaction data; industry reference material on FX market participants and intermediation.